India's murder rate by state, from the NCRB's Crime in India 2023, is highest in Manipur at 4.7 murders per lakh people, followed by Jharkhand (3.7), Arunachal Pradesh (3.6), Haryana (3.4) and Chhattisgarh (3.2). The national rate is 2.0 per lakh, the lowest since records began in 1953, and Jammu and Kashmir, often imagined as India's most violent region, recorded just 0.6.
- India registered 27,721 murders in 2023, down 2.8% from 28,522 in 2022.
- The rate peaked at 4.6 per lakh in 1991 and has more than halved since.
- Manipur's recorded murders tripled from 47 to 151 in one year, after ethnic violence began in May 2023.
- J&K (0.6), Ladakh (0.7) and Nagaland (0.8) have some of the lowest registered rates in India.
- Most murders are personal: vendetta, family disputes and petty quarrels top the known motives.
- These are registered FIRs, not all killings; the UN's broader homicide measure puts India nearer 2.8.
Most people carry a mental map of Indian danger built from headlines: Kashmir, Bihar, Delhi. The registered data draws a different map. This post ranks all 36 states and union territories by murder rate, explains why Manipur jumped to the top, and shows where the numbers mislead.
All rates below are murders per lakh (100,000) population, from NCRB's 2023 report, the latest full year published. Using rates, not raw counts, matters: Uttar Pradesh records the most murders simply because it has about 23.6 crore people.
Which state has the highest murder rate in India?
Manipur had the highest murder rate of any state or UT in 2023, at 4.7 per lakh, more than double the national 2.0. Among union territories, Delhi was highest at 2.4, with 506 murders.
The rest of the top tier is a belt of eastern and north-eastern states plus Haryana. Jharkhand (3.7) and Chhattisgarh (3.2) carry the legacy of Maoist conflict and land disputes; Arunachal Pradesh (3.6) has a small population, so a few dozen cases swing its rate a lot; Haryana (3.4) is the outlier in the prosperous north-west.
On 3 May 2023, clashes broke out in Manipur between the Meitei majority of the Imphal Valley and the Kuki-Zo tribal communities of the surrounding hills. By November 2024, government figures counted 258 dead, more than 60,000 displaced and 4,786 houses burnt. The NCRB's murder column caught part of it: Manipur's registered murders went from 47 in 2022 to 151 in 2023, and its rate jumped from 1.5 to 4.7, taking it from mid-table to first. The Centre imposed President's Rule on 13 February 2025; it was revoked on 4 February 2026. Manipur has been here before. In 1993, during an earlier wave of insurgency and ethnic violence, it recorded a rate of 16.4, the highest in the history of India's crime data.
Wikipedia: 2023–2025 Manipur violence and Data for India: Homicide in IndiaTap a state to see its figure; the full table follows.
Map: Murder rate by state and UT, 2023
- Manipur: 4.7 per lakh
- Jharkhand: 3.7 per lakh
- Arunachal Pradesh: 3.6 per lakh
- Haryana: 3.4 per lakh
- Chhattisgarh: 3.2 per lakh
- Assam: 2.9 per lakh
- Odisha: 2.9 per lakh
- Telangana: 2.5 per lakh
- Delhi: 2.4 per lakh
- Tripura: 2.4 per lakh
- Punjab: 2.2 per lakh
- Rajasthan: 2.2 per lakh
- Bihar: 2.2 per lakh
- Tamil Nadu: 2.2 per lakh
- Madhya Pradesh: 2.1 per lakh
- Andaman & Nicobar: 2.0 per lakh
- Mizoram: 1.9 per lakh
- Karnataka: 1.9 per lakh
- Meghalaya: 1.8 per lakh
- Sikkim: 1.7 per lakh
- West Bengal: 1.7 per lakh
- Maharashtra: 1.7 per lakh
- Andhra Pradesh: 1.7 per lakh
- Puducherry: 1.7 per lakh
- Uttarakhand: 1.6 per lakh
- Goa: 1.6 per lakh
- Dadra & Nagar Haveli and Daman & Diu: 1.5 per lakh
- Chandigarh: 1.4 per lakh
- Uttar Pradesh: 1.4 per lakh
- Gujarat: 1.3 per lakh
- Himachal Pradesh: 1.2 per lakh
- Kerala: 1.0 per lakh
- Nagaland: 0.8 per lakh
- Ladakh: 0.7 per lakh
- Jammu & Kashmir: 0.6 per lakh
- Lakshadweep: 0 per lakh
The full 2023 ranking: top 10 and bottom 10
The table below ranks states and UTs by registered murder rate. Uttar Pradesh, despite its reputation, sits in the bottom third by rate (1.4), even though it records the most murders by count.
| Rank | State or UT | Murders per lakh, 2023 | Note |
|---|---|---|---|
| 1 | Manipur | 4.7 | Ethnic violence from May 2023 |
| 2 | Jharkhand | 3.7 | 5.6 in 2001, falling |
| 3 | Arunachal Pradesh | 3.6 | Small population, volatile |
| 4 | Haryana | 3.4 | Highest in the north-west |
| 5 | Chhattisgarh | 3.2 | Maoist-affected districts |
| 6 | Assam | 2.9 | |
| 6 | Odisha | 2.9 | |
| 8 | Telangana | 2.5 | |
| 9 | Delhi | 2.4 | Highest UT; 506 murders |
| 9 | Tripura | 2.4 | |
| 28 | Uttar Pradesh | 1.4 | Most murders by count |
| 30 | Gujarat | 1.3 | |
| 31 | Himachal Pradesh | 1.2 | |
| 32 | Kerala | 1.0 | 1.9 in 1991 |
| 33 | Nagaland | 0.8 | |
| 34 | Ladakh | 0.7 | |
| 35 | Jammu and Kashmir | 0.6 | 84 murders; 10.7 in 2001 |
| 36 | Lakshadweep | 0 | No murders registered |
Ties share a rank. Rates are rounded to one decimal, so small differences, such as Chandigarh 1.4 versus Uttar Pradesh 1.4, are not meaningful.
Is Kashmir dangerous compared with other states?
By registered murder, no: J&K recorded 84 murders in 2023, a rate of 0.6, the second lowest in India after Lakshadweep, and down from 136 in 2021. But a murder rate is not a terrorism risk score, and the two answers can both be true.
- What the number measures: FIRs registered under the murder section. Everyday violence in J&K, such as family and property killings, is rare by Indian standards.
- What it can miss: conflict deaths are tracked in different ways. Security-force encounters are not murders, and a single attack is one event however many die in it.
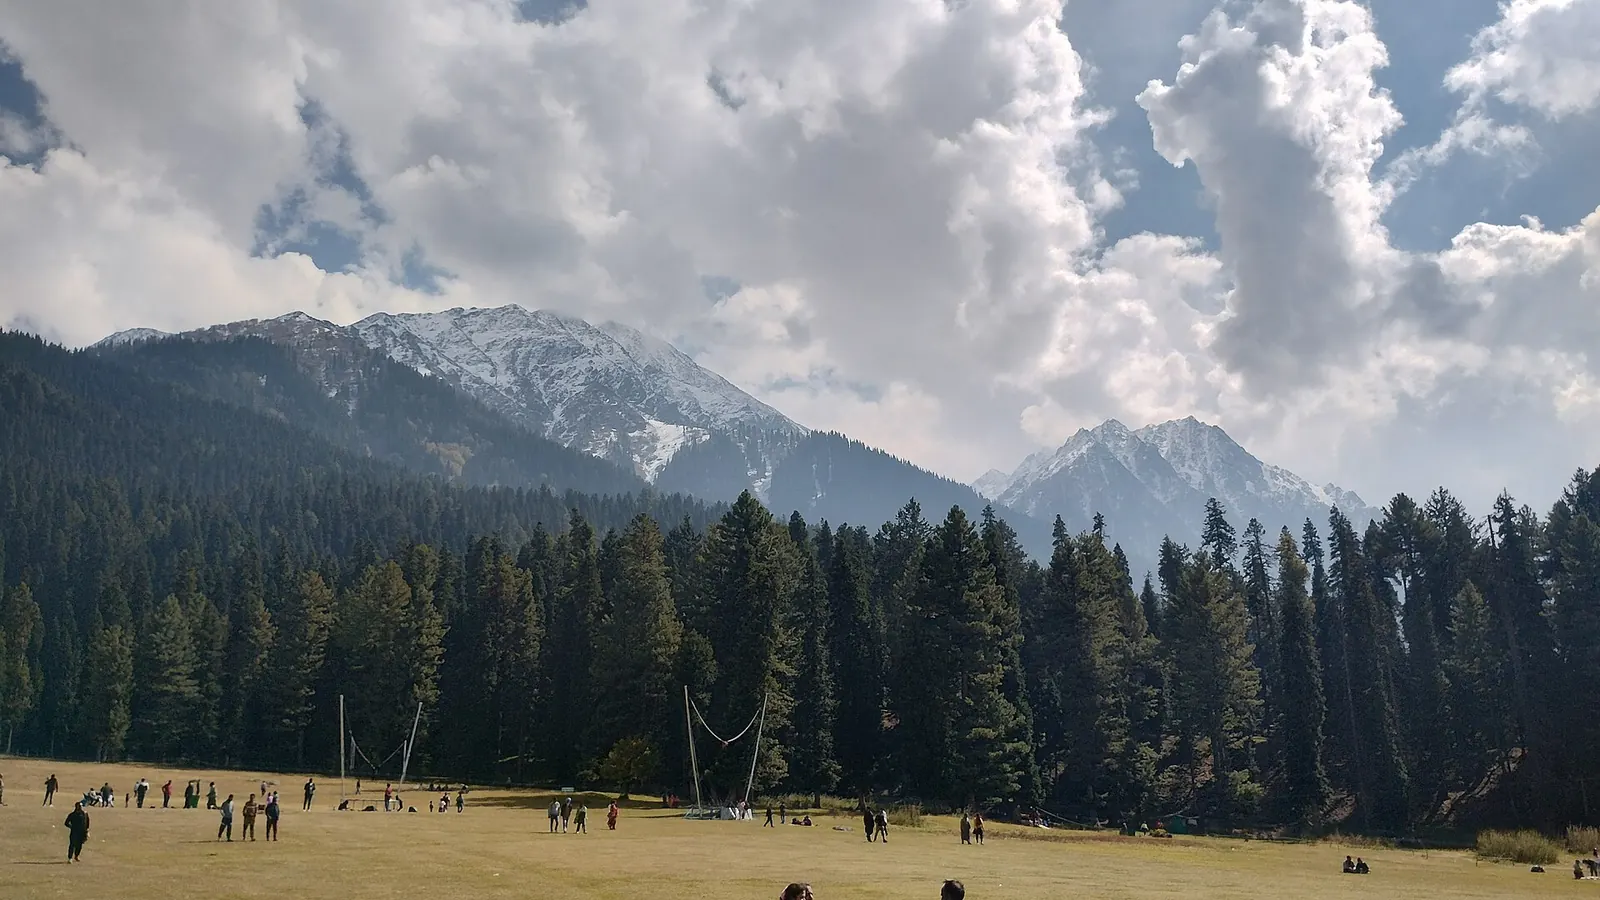
- Why governments still warn: on 22 April 2025, gunmen killed 26 people, 25 of them tourists, at Baisaran meadow near Pahalgam. The UK still advises against all travel to J&K except Jammu city, and Canada advises avoiding all travel to J&K excluding Ladakh.

Why has India's murder rate fallen to a record low?
India's registered murder rate has fallen from a peak of 4.6 per lakh in 1991, when 39,174 murders were recorded, to 2.0 in 2023. In 1953 the rate was 2.7, so today is the lowest point in 70 years of data.
See the data as a table
| Murders per lakh people (per lakh) | |
|---|---|
| 1953 | 2.7 |
| 1960 | 2.5 |
| 1970 | 2.9 |
| 1980 | 3.3 |
| 1985 | 3.5 |
| 1990 | 4.2 |
| 1991 | 4.6 |
| 1995 | 4.1 |
| 2000 | 3.7 |
| 2005 | 3.0 |
| 2010 | 2.8 |
| 2015 | 2.6 |
| 2020 | 2.2 |
| 2023 | 2.0 |
Source: NCRB Crime in India series, compiled by Data for India · Registered murders (IPC 302, now BNS 103) only.
No single study explains the whole fall, but the data point to three things.
- Insurgencies ended or shrank. Punjab's rate was 15.0 in 1991, at the height of militancy, and 3.1 by 1995. J&K went from 10.7 in 2001 to 1.3 in 2011.
- The Hindi heartland calmed. Bihar fell from 5.1 in 1991 to 2.2 in 2023; Delhi from 5.2 to 2.4.
- Fewer men are killed. Male victims fell from 30,460 in 1999 to 20,756 in 2023, while female victims stayed near 7,800. Almost all the decline is among men.
See the data as a table
| Punjab (per lakh) | Manipur (per lakh) | Jammu and Kashmir (per lakh) | Delhi (per lakh) | Kerala (per lakh) | |
|---|---|---|---|---|---|
| 1991 | 15.0 | 5.4 | 7.1 | 5.2 | 1.9 |
| 1995 | 3.1 | 12.7 | 9.4 | 4.7 | 1.6 |
| 2001 | 3.0 | 8.7 | 10.7 | 4.0 | 1.5 |
| 2011 | 3.0 | 2.9 | 1.3 | 3.2 | 1.1 |
| 2023 | 2.2 | 4.7 | 0.6 | 2.4 | 1.0 |
Source: NCRB Crime in India series, compiled by Data for India
The authors compared murder rates across Indian districts using 1981 NCRB data and census variables. Murder rates showed no significant link with poverty or urbanisation, a negative link with literacy, and a strong negative link with the female-to-male ratio: districts with more women relative to men had fewer murders. They read both as symptoms of a patriarchal environment rather than one causing the other. Limit: it is a single-year, cross-section study of correlations, using registered crime.
Read the abstract (free)What drives murders in India?
Most murders in India are personal, not random. Of the 27,721 murders in 2023, the largest known motives were personal vendetta (3,458), family disputes (3,220) and petty quarrels (3,097). Stranger crime for gain was 1,890 cases, under 7%.
See the data as a table
| Murders (cases) | |
|---|---|
| Other causes | 8499 |
| Personal vendetta or enmity | 3458 |
| Family dispute | 3220 |
| Petty quarrel | 3097 |
| Property or land dispute | 1905 |
| Gain | 1890 |
| Love affairs | 1441 |
| Illicit relationship | 1389 |
| Motive not known | 1050 |
| Money dispute | 939 |
| Dowry | 833 |
Source: NCRB Crime in India 2023, Table 2A.2, via Data for India
This shapes how you should read a high-rate state. A Haryana or Jharkhand figure mostly reflects disputes among people who know each other: land, family, honour and money. For a visitor, the risk from that kind of violence is low; for residents, it is a story about property law, policing and gender, which why most murders in India are personal unpacks.
India's typical murder victim is a man killed by someone he knows, over land, family or a grudge.
A dynamic panel model of 23 Indian states from 2001 to 2021 tested whether legal deterrence (conviction rates, police strength) and economic factors explain crime. Higher conviction rates were linked to fewer attempted murders, kidnappings and cheating cases, and night-light inequality was linked to more attempted murder. Police strength had a non-linear effect. Limit: it uses registered crime, so states that record more crime can look worse, and correlations are not proof of cause.
Read the abstractHow does India's murder rate compare with other countries?
India's rate is low by world standards. Using the UN's broader "intentional homicide" measure, which adds dowry deaths and culpable homicide to murder, India was at about 2.8 per lakh in 2022, against 5.8 in the United States and 19.3 in Brazil (2023).
| Country | Intentional homicides per lakh | Year |
|---|---|---|
| Mexico | 24.9 | 2023 |
| Brazil | 19.3 | 2023 |
| Nigeria | 15.7 | 2023 |
| Russia | 6.8 | 2021 |
| United States | 5.8 | 2023 |
| Pakistan | 4.3 | 2023 |
| India | 2.8 | 2022 |
| Bangladesh | 2.3 | 2018 |
| China | 0.5 | 2020 |
| Indonesia | 0.3 | 2022 |
Because India is so large, it has the second-highest number of homicide victims in the world after Brazil, but ranked 46th of 108 countries by rate in 2022. Among the ten most populous countries, only China and Indonesia report lower rates. India's homicide rate against the world goes deeper into the definitions.
What the murder data cannot tell you
NCRB counts FIRs registered under one section, not every killing. That makes it useful for trends and rough comparisons, and risky for fine rankings.
- Only three heads count as homicide: murder, culpable homicide not amounting to murder, and dowry death. Some killings are filed as accidents or suicides.
- Model estimates run higher: WHO's Global Health Estimates put India's 2021 rate at 3.66 and IHME at 3.69, against UNODC's 2.92. Both are models, not counts.
- Principal-offence rule: when one FIR lists several offences, NCRB counts only the one with the heaviest punishment, so a robbery that ends in murder appears only as a murder.
- Small states swing: Arunachal Pradesh or Sikkim can move a full point on a handful of cases. Read their ranks with care.
Use this to put any rate in personal terms. It shows the chance, at a given rate, of being a victim over a number of years, assuming the rate stays flat and you are an average resident.
What does a murder rate mean over a lifetime?
What should a visitor or new resident do with this?
Treat the murder map as one input, not a safety verdict. For most travellers in India, road crashes are a far bigger killer than violent crime, as road deaths by state shows.
- Check the advisory, not just the rate. Conflict zones such as parts of Manipur and J&K carry curfew and internet-shutdown risks the murder column does not capture.
- Save 112. It is India's single emergency number for police, fire and ambulance; see India's emergency numbers.
- Know you can file anywhere. A Zero FIR can be registered at any police station regardless of where the crime happened; our Zero FIR guide has the steps.
- Avoid disputes, not regions. Since most murders grow out of quarrels, walking away from road rage, drunken arguments and property fights does more for your safety than skipping a state.
If you ride or drive long distances, the planning habits in the solo touring safety plan matter more day to day than any crime table.
What's new
- Data for India updates its homicide explainer with NCRB 2023 data Data for India, Nov 2026
- President's Rule in Manipur revoked; new Kuki-Naga clashes around Litan Wikipedia summary of reports, Feb 2026
- J&K had India's second-lowest murder rate in 2023 The Tribune, 2025
- The Pahalgam attack kills 26, mostly tourists Wikipedia summary of reports, Apr 2025
Questions people ask
Which state has the highest murder rate in India?
Manipur, at 4.7 murders per lakh people in 2023, according to NCRB. Jharkhand (3.7), Arunachal Pradesh (3.6), Haryana (3.4) and Chhattisgarh (3.2) follow. In 2022, before the Manipur violence, Jharkhand was top.
Which state has the most murders?
By raw count, Uttar Pradesh, followed by Bihar, Maharashtra, Madhya Pradesh and Rajasthan. These are India's most populous states, which is why rates per lakh are the fairer comparison.
Is Kashmir safe compared with the rest of India?
For everyday crime, J&K's registered murder rate (0.6 in 2023) is among India's lowest. Terrorism is a separate risk: the 2025 Pahalgam attack targeted tourists, and the UK and Canada advise against travel to J&K except Jammu city and Ladakh. Read the current advisories before you go.
Is India's murder rate high?
No. At about 2.8 intentional homicides per lakh (UNODC, 2022), India is below the United States (5.8) and far below Brazil (19.3) or Mexico (24.9). Its large population gives it a high total count.
Which is the safest state in India by murder rate?
Lakshadweep registered no murders in 2023. Among larger places, J&K (0.6), Ladakh (0.7), Nagaland (0.8) and Kerala (1.0) had the lowest registered rates. Low reporting is less of a problem for murder than for other crimes, but it is not zero.
Sources
- Data for India: Homicide in India (state rates, long-run series, motives, victims by sex, UNODC comparison) (2026)
- NCRB: Crime in India 2023, snapshots and population tables (2025)
- NCRB: Crime in India 2023, methodology (principal offence rule) (2025)
- The Tribune: J&K had 2nd lowest rate of murder cases in India in 2023 (2025)
- Drèze and Khera: Crime, Gender, and Society in India: Insights from Homicide Data, Population and Development Review (2000)
- Mathen and Chattopadhyay: Determinants of Crime in India: Does Conviction Matter? Journal of Public Affairs (2025)
- Wikipedia: 2023–2025 Manipur violence (death toll, displacement, President's Rule) (2026)
- Wikipedia: 2025 Pahalgam attack (2026)
- GOV.UK: India travel advice, warnings and insurance (updated 7 Oct 2026)
- Government of Canada: Travel advice for India (updated 6 Nov 2026)

Sapta (Saptarshi Sarkar) is a mechanical engineer turned marketer in Bengaluru and a solo touring rider. He writes the seven Saptaverse blogs. Work with him or read more of Whyblog.