
Most D2C brands in India stall well before ₹100 crore because the model that gets them to ₹20–30 crore stops working: over 70% depend on Meta as their main acquisition channel, repeat purchase rates mostly sit between 10% and 30%, and about a quarter of cash-on-delivery orders come back. As spend rises, each new customer costs more, a slice of revenue never arrives, and the customers who do return increasingly buy on marketplaces and quick-commerce apps. Brands that break through fix repeat, payment mix and channel mix before they raise the ad budget.
- 60–65% of Indian D2C brands stay in the ₹1–50 crore band, per the December 2025 DSG survey.
- 70%+ rely on Meta as their main acquisition channel, and 62% report creative fatigue.
- COD orders came back 26% of the time in FY25, against under 2% for prepaid (Shipway).
- At a 1.4-order repeat rate and ₹700 CAC, a typical customer takes 1.8 orders just to repay acquisition.
Calculated in this post with these example inputs (₹900 order value, 55% gross margin, ₹150 loss per returned order, ₹700 CAC, 1.4 orders a customer) and two sourced figures: COD at about 60% of orders (Upstox, citing ET Prime Research) and a 26% COD return rate (%s). Gross profit per order placed is about ₹394, and 700 / 394 is about 1.8 orders.
- Quick-commerce ad spend rose from ₹1,325 crore in 2024 to ₹4,000 crore in 2025.
A December 2025 survey of more than 100 Indian D2C founders and operators, by DSG Consumer Partners with Meta and Viralmint and reported by Entrepreneur India, put a number on the wall: 60% to 65% of brands remain in the ₹1–50 crore revenue band, and only a small fraction cross ₹100 crore.
This post walks through the four forces behind that, with the data that exists, and what the brands that get past it do differently:
- Acquisition cost that rises with every rupee of scale;
- Platform ROAS that overstates what ads really add;
- COD returns that cut real revenue;
- Repeat customers who drift to marketplaces and quick commerce.
Why does customer acquisition cost rise as D2C brands scale?
Customer acquisition cost rises with scale because a brand first reaches the people most likely to buy, then has to pay more to reach each next, less-interested group. Paid social auctions make this visible fast: the first lakh of customers come from the warmest audiences, and every lakh after that is colder.
In the DSG survey, 62% of founders reported creative fatigue, where repeated creatives stop sustaining ROAS even as spend rises.
The money that once hid the problem has also thinned. Tracxn's data shows Indian tech funding at $10.5 billion in 2025, against $12.7 billion in 2024, with the retail sector, which includes most D2C brands, falling from $3.1 billion in 2023 to $2.4 billion in 2025. Brands can no longer count on the next round to subsidise rising acquisition costs.
See the data as a table
| All India tech funding ($ bn) | Retail sector ($ bn) | |
|---|---|---|
| 2023 | 11.0 | 3.1 |
| 2024 | 12.7 | 2.9 |
| 2025 | 10.5 | 2.4 |
Source: Tracxn India Tech Annual Funding Report 2025 (Dec 2025) · 2025 figure is year to date up to 15 December 2025.
Founders describe the squeeze plainly, and one of them has put numbers on his own path.
When Ashutosh Valani co-founded Renée Cosmetics about five and a half years before he spoke to Inc42 in July 2026, the brand spent roughly one rupee on advertising and brand building for every rupee of revenue. Over time that ratio improved to about 0.7–0.75:1, and then to about 0.45:1.
He had expected marketing to fall below 40% of revenue by now. It had not: it still took about 45%, because Meta and Google ads, influencer marketing and competition from large FMCG companies kept getting dearer (Inc42). What changed the shape of the business was where it sold. About 65% of Renée's sales now came from offline stores and 35% online, and only about a quarter of the online business came through its own website.
Inc42: The end of the ROAS era in D2C? (Jul 2026)Kae Capital's Sunitha Viswanathan called the end of cheap Meta and Google growth a permanent reset. The full maths of when a customer pays back is in my post on CAC payback and LTV for Indian D2C.

Why do Meta ROAS numbers overstate how well D2C ads work?
Meta ROAS overstates performance because the platform counts purchases by people who saw an ad, and many of them would have bought anyway. The cleanest evidence comes from large experiments where some users were randomly held out from seeing ads.
The authors used 15 US advertising experiments at Facebook, covering 500 million user-experiment observations and 1.6 billion ad impressions, where the true effect was known from randomised holdouts. They then estimated the same effects with the observational methods advertisers usually rely on. The observational methods generally overestimated ad effectiveness, sometimes badly: in half of the studies, the estimated percentage lift in purchases was off by a factor of three across all methods. The limit: US campaigns from the mid-2010s, before Meta's current AI-driven delivery, though the core bias, that ads reach people already likely to buy, has not gone away.
Read the paper (free)Kae Capital's warning to Inc42 makes the same point in Indian money: a 3x ROAS can coexist with a real margin of about 5% once the cost of goods, discounts and returns are taken out.
When a brand plans growth on platform ROAS, it plans on a number that is both inflated and gross of the costs that matter.
How much do COD returns cost an Indian D2C brand?
Cash on delivery costs D2C brands a quarter of their COD orders and the shipping both ways on each one. Shipway's ShipNotes report on millions of FY25 shipments found prepaid orders were returned less than 2% of the time, against about 26% for COD orders. The longer delivery took, the worse it got.
| Shipway FY25 data | Return to origin rate |
|---|---|
| Prepaid orders | Under 2% |
| COD orders, all | About 26% |
| COD, delivery attempted in 1–2 days | 22% |
| COD, delivery attempted in 3–5 days | 27% |
| COD, delivery attempted after 5 days | 35% |
| Lowest city: Vadodara | 18% |
| Highest city: Patna | 35% |
Why COD cannot simply be switched off
COD is not optional in India. Upstox, citing ET Prime Research, puts COD at roughly 60% to 65% of e-commerce orders, and Meesho's prospectus showed prepaid at only 23% of its shipped orders in FY25.
Upstox also cites a RedSeer estimate that RTO and failed deliveries cost Indian e-commerce more than ₹20,000 crore a year. A brand that scales into smaller towns, where COD shares are higher, scales its RTO problem with it.
Use this to check what you just read: plug your own numbers into the calculator to see what COD does to a customer's value.
What COD returns do to D2C customer value
With the default values, about 16% of orders never arrive, gross profit per order placed falls to about ₹394, and the customer has to order about 1.8 times just to repay acquisition.
Calculated in this post with the calculator's example inputs (60% of orders on COD at a 26% return rate, ₹900 order value, 55% gross margin, ₹150 loss per return, ₹700 CAC): 60% × 26% = 15.6%; gross profit per order placed is about ₹394; 700 / 394 is about 1.8 orders. COD share from Upstox, return rate from Shipway.
If your repeat rate means the average customer orders 1.4 times a year, the brand loses money on every new customer for the first year. That is the stall in one line. The practical fixes, from COD confirmation calls to partial prepayment, are in my guide to reducing COD RTO for Indian D2C.
Why do repeat customers drift to marketplaces and quick commerce?
Repeat customers drift to marketplaces and quick-commerce apps because those apps are already on their phones, deliver in minutes and save the address and payment. A D2C site has to win the first order with an ad and then win every repeat order against a platform the customer opens daily.
In the DSG survey, 55% of founders admitted under-investing in CRM and retention, which leaves the repeat customer to whoever is most convenient.
The ad money is following the shoppers. Pitch Madison's 2026 report put quick-commerce ad spend at ₹1,325 crore in 2024 and ₹4,000 crore in 2025, with about ₹6,000 crore projected for 2026, while e-commerce and retail media advertising overall reached ₹10,257 crore in 2025. A brand that wants shelf space on Blinkit, Zepto or Instamart increasingly pays for it as advertising. I rank the platforms in retail media in India ranked by ad revenue.
See the data as a table
| Quick-commerce ad spend (₹ crore) | |
|---|---|
| 2024 | 1325 |
| 2025 | 4000 |
| 2026 (projected) | 6000 |
Source: Pitch Madison Advertising Report 2026, via Social Samosa (Feb 2026) · 2026 is a projection. Other estimates, such as Datum Intelligence, are lower.
This is not all bad news. Renée, in the story above, told Inc42 that 65% of its sales come from offline stores and 35% online, with only about a quarter of online sales through its own website. A brand that is easy to find on Amazon, Nykaa, Blinkit and in a store has more ways to reach ₹100 crore than one that only sells through its own site.
| Channel | What it gives | What it costs |
|---|---|---|
| Own website | Customer data, full range, bundles | Paid acquisition for every visit |
| Marketplaces and quick commerce | Repeat buyers who already shop there | Commissions, ad fees; the platform owns the customer record |
| Offline and modern trade | Reach that is not repriced in an auction | Slow to build, distributor margins |
The risk is margin and data: platform commissions and ad fees are high, and the platform, not the brand, owns the customer record.

What do D2C brands that cross ₹100 crore do differently?
Brands that cross ₹100 crore usually stop treating Meta as the business and start treating it as one channel. The pattern across founder interviews and the survey data is consistent: they build repeat purchase, fix the payment mix, add marketplaces and offline, and invest in brand so that acquisition gets cheaper rather than dearer.
- Earn the second order deliberately. Lift repeat from the 10–30% band with product range, subscriptions, sampling, WhatsApp and email flows. Every point of repeat lowers the effective cost of each customer.
- Price the COD risk. Nudge prepaid with small discounts, confirm COD orders before dispatch, take partial prepayment in high-RTO pin codes and route through faster couriers. Shipway's data shows each extra day of delivery raises returns.
- Measure incrementally. Run holdout tests on Meta and Google, and judge spend on blended CAC and contribution margin, not platform ROAS, as the Gordon et al. evidence suggests.
- Go where the repeat customer already shops. Marketplaces, quick commerce and modern trade, with clear rules on pricing and which SKUs go where.
- Build the brand while it is still small. Traya's Saloni Anand told Inc42 the brand delays digital spend until its communication is proven, and checks that each ad is recognisably Traya even without the logo. I explain the long-term logic in brand vs performance marketing.
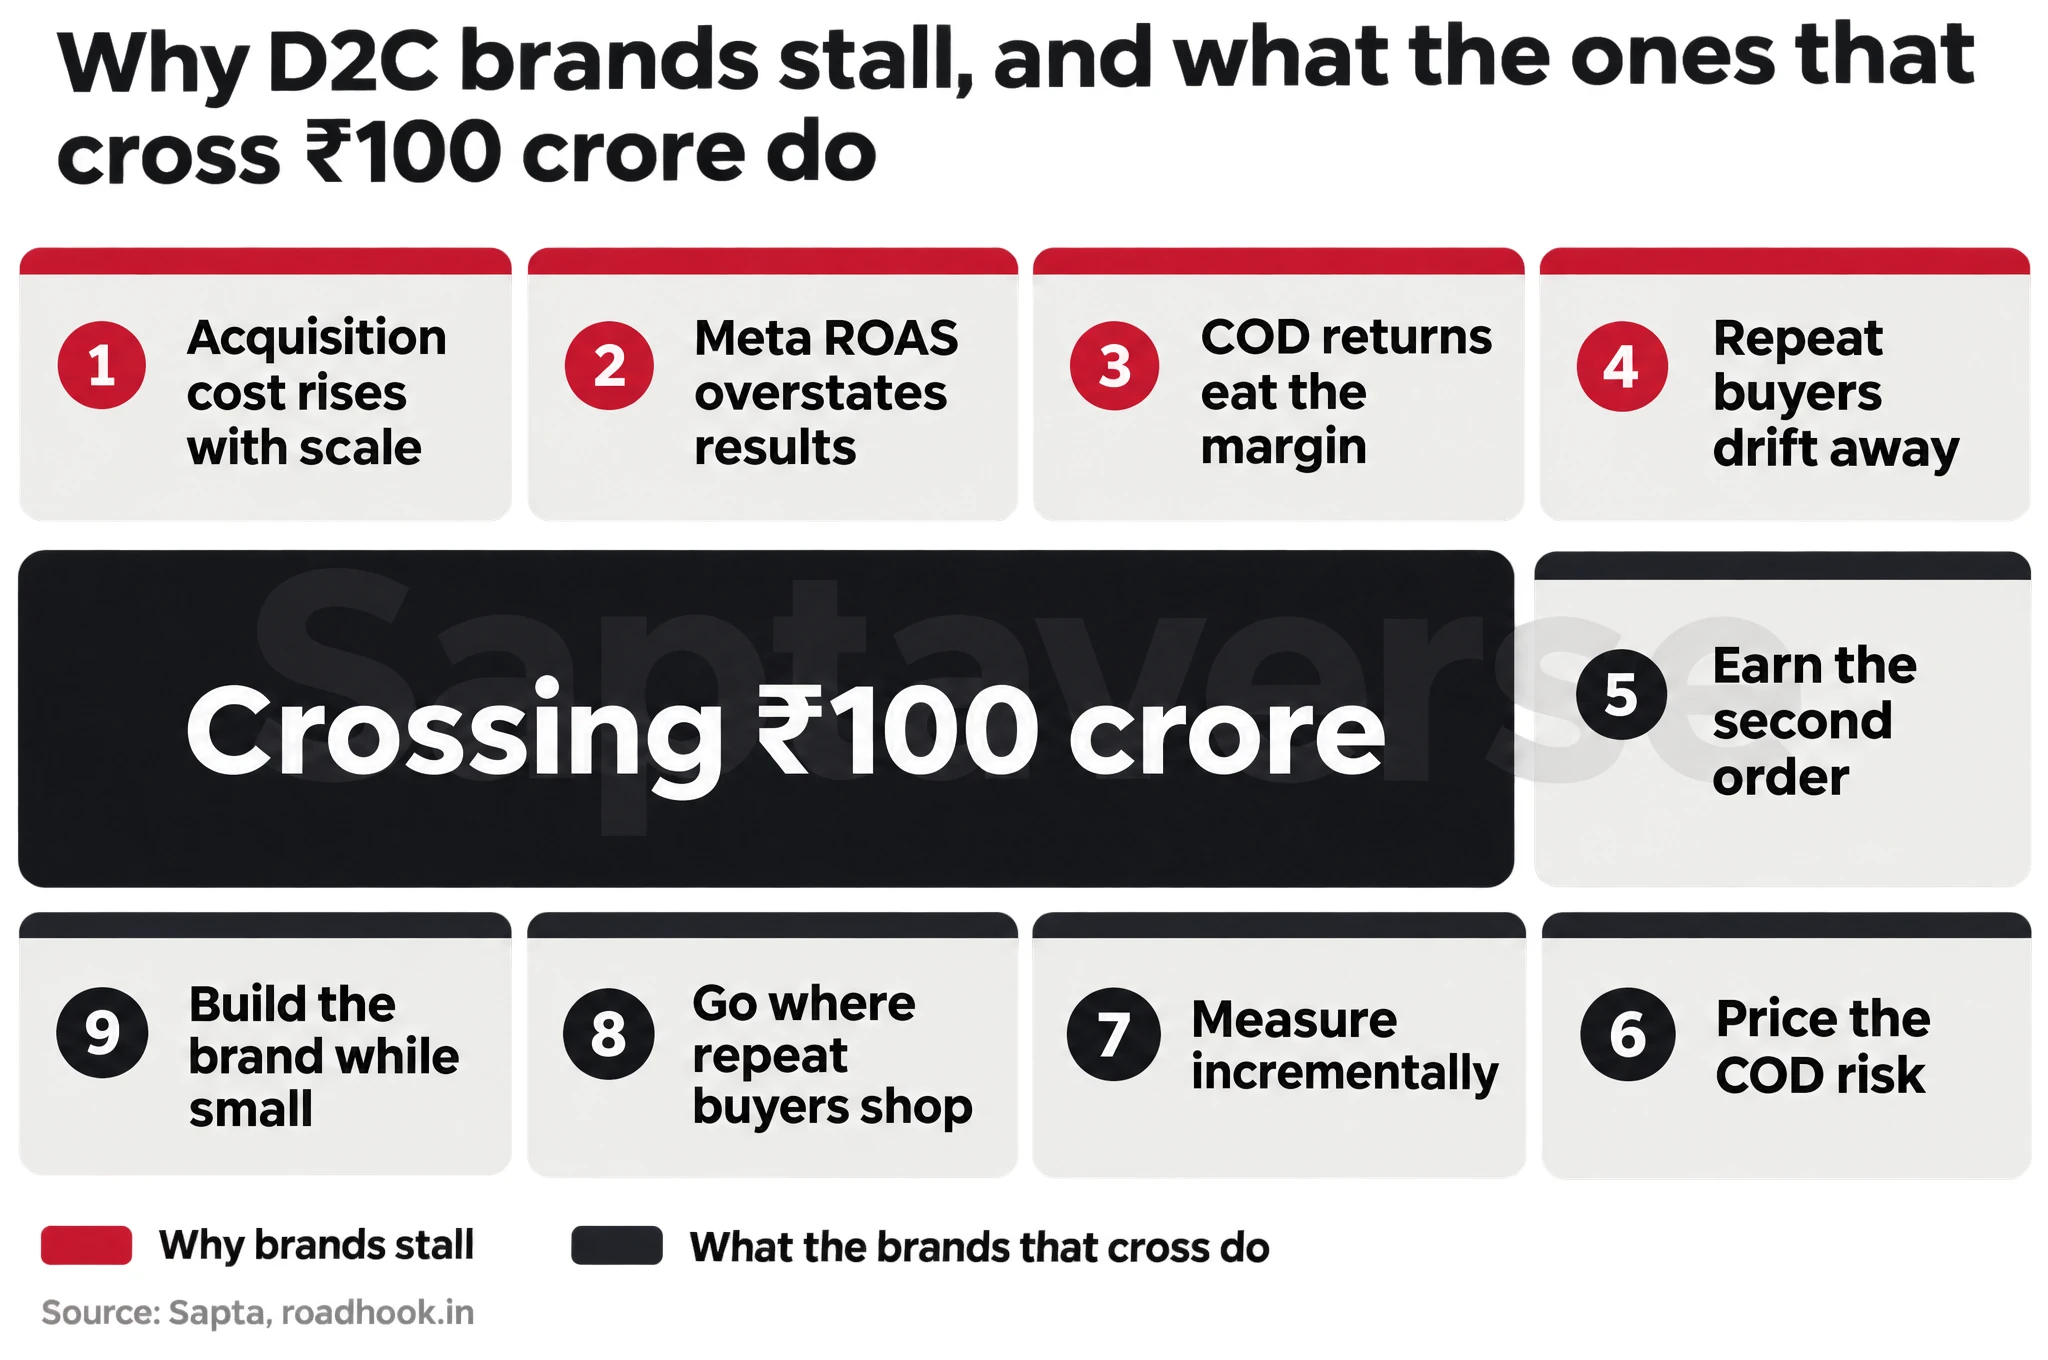
- Acquisition cost rises with scale: each next, less-interested group costs more to reach
- Meta ROAS overstates results: it counts buyers who would have bought anyway
- COD returns eat the margin: about 26% of COD orders return, against under 2% prepaid
- Repeat buyers drift away: to marketplaces and quick commerce
- Earn the second order: lift repeat from the 10-30% band
- Price the COD risk: nudge prepaid, confirm COD, partial prepayment
- Measure incrementally: holdout tests; blended CAC, not platform ROAS
- Go where repeat buyers shop: marketplaces, quick commerce, modern trade
- Build the brand while small: so acquisition gets cheaper, not dearer
The search-ad evidence adds a final twist. In eBay's experiments, published by Blake, Nosko and Tadelis, paid search worked on new and infrequent users and was wasted on frequent ones, who bought anyway.
eBay switched paid search off and on in randomised US regions. Brand-keyword ads had no measurable short-term benefit: 99.5% of the lost clicks came back through organic results. For non-brand keywords, ads helped new and infrequent users but most spend went on frequent users whose purchases were unaffected, giving an average experimental ROI of minus 63%, against 4,173% in a naive analysis. The limit: eBay is far better known than any young D2C brand, so new brands gain more from search than eBay did.
Read the paper (free)For a D2C brand, the lesson is to stop paying ad platforms to re-acquire customers you already have. Retargeting and branded search on existing buyers often claim credit for orders that owned channels such as WhatsApp, email and the app could bring back at a fraction of the cost. The money saved is the budget for reaching new people. The story of how one brand ran this playbook at scale before listing is in Mamaearth's IPO and its ad spend.
Is ₹100 crore the right goal for a D2C brand?
₹100 crore is a useful milestone, not a law of nature; the better goal is profitable, repeatable growth. Pooja Shirali of DSG Consumer Partners told Entrepreneur India that the first ₹100 crore becomes predictable through long-term fundamentals rather than viral moments, and Third Eyesight's Devangshu Dutta argued that early-stage leaders should focus on unit economics and cash flow. A ₹60 crore brand with 20% contribution margin and high repeat is a better business than a ₹120 crore brand buying every order.
The work that moves a brand from the stall to the next stage is mostly unglamorous: retention flows, payment-mix rules, courier choices, marketplace pricing and patient brand building. If you run a D2C brand in that band and want a second pair of eyes on the numbers, my hire page explains how I work. For food brands specifically, see how a D2C food brand can grow online sales in India.
What's new
- Inc42: Indian D2C founders say the ROAS era is ending as CAC rises Inc42, Jul 2026
- Pitch Madison: quick-commerce ad spend projected near ₹6,000 crore in 2026 Social Samosa, Feb 2026
- Tracxn: India tech funding at $10.5 billion in 2025 Tracxn, Dec 2025
- Survey: why most Indian D2C brands fail to cross ₹100 crore Entrepreneur India, Dec 2025
Questions people ask
Why do most D2C brands fail in India?
Most do not fail outright; they stall. The common causes are heavy dependence on Meta for acquisition, low repeat purchase, high COD return rates that cut real revenue, and rising ad costs without the funding to absorb them. Brands that survive fix unit economics before scaling spend.
What is a good repeat purchase rate for an Indian D2C brand?
The DSG survey found most Indian D2C brands at 10% to 30%. The right target depends on the category: consumables such as food, skincare and supplements should aim well above that band, while durable goods will naturally sit lower and need higher margins per order.
How can a D2C food brand grow online sales?
Build trust first with reviews, founder-led content and clear sourcing, then use retargeting on people who already know you before scaling cold ads. Food is a repeat category, so subscriptions, sampling and WhatsApp reorder flows matter more than the first sale.
Should a D2C brand sell on Amazon and quick commerce?
Usually yes, once the product and brand are proven, because that is where many repeat customers already shop. Protect margin by choosing which SKUs go where, budgeting for platform ads, and using the brand site for the full range, bundles and customer data.
Sources
- Entrepreneur India: Why most Indian D2C brands fail to cross ₹100 crore (DSG Consumer Partners, Meta, Viralmint survey) (2025)
- Inc42: The end of the ROAS era in D2C? (2026)
- Tracxn: India Tech Annual Funding Report 2025 (2025)
- Social Samosa: Pitch Madison Advertising Report 2026 (2026)
- Home Fashion Trends: Shipway analyzes key drivers behind India's e-commerce RTOs (ShipNotes FY25) (2025)
- Upstox: Is cash on delivery quietly costing you more? (2025)
- Gordon, Zettelmeyer, Bhargava and Chapsky: A Comparison of Approaches to Advertising Measurement (2019)
- Blake, Nosko and Tadelis: Consumer Heterogeneity and Paid Search Effectiveness, NBER (2014)
- Reddit r/digital_marketing: How to grow online sales for a D2C food brand now? (2026)

Sapta (Saptarshi Sarkar) is a mechanical engineer turned marketer in Bengaluru and a solo touring rider. He writes the seven Saptaverse blogs. Work with him or read more of Marketblog.


