
Measured in Indian feeding studies, most everyday staples are medium to high glycaemic index (GI): rice idli about 85, plain dosa about 79, milled rice about 72 on average, chapati about 62, while legume-heavy dishes such as vada sambar (37) and chickpea sundal (24) are low. Millets average about 53 across studies, but preparation can override the grain: a 2022 Chennai study measured ragi mudde at 98, well above the 72 average for milled rice. Fermentation alone doesn't make a food low-GI; protein, fat, fibre, particle size and cooling do more.
- Ragi mudde tested 98 in a 2022 Chennai study, above milled rice's average of 72: preparation can beat the grain.
- Rice idli 85, dosa 79, chapati 62: most everyday staples are medium to high GI.
- Vada sambar 37, chickpea sundal 24: pulses pull a plate down the most.
- Millets average 52.7 across 39 studies, but steaming, baking or boiling adds 11–18 units.
- Cooled, reheated rice gave an 18% lower glucose response in a 15-person trial: real, but modest.
- 62% of calories in Indian diets come from carbohydrate (ICMR-INDIAB, 2025), against a 45% cap on cereals in ICMR-NIN's 2024 guidelines.
GI is the most misquoted number in Indian nutrition. Packets and influencers print single values for "ragi" or "chapati" as if they were constants, when the same flour can test 45 in one lab and 84 in another depending on the recipe and the people tested.
This post sticks to published feeding studies on Indian foods. It:
- pulls the numbers into one ranking;
- explains why they move (milling, cooking, cooling, pairing);
- sets them against ICMR-NIN's 2024 dietary guidelines and the 2025 ICMR-INDIAB diet survey.
What do glycaemic index and glycaemic load measure?
GI ranks how fast a food's carbohydrate raises blood glucose compared with pure glucose (GI 100), using a portion with 50 g of available carbohydrate. Glycaemic load (GL) multiplies GI by the carbohydrate in a real serving, so it reflects how much the meal you actually eat will raise glucose.
The number was invented in March 1981. David Jenkins, Thomas Wolever and eight colleagues published Glycemic index of foods: a physiological basis for carbohydrate exchange in the American Journal of Clinical Nutrition. They had fed 62 common foods and sugars, one at a time, to groups of 5 to 10 healthy fasting volunteers, and measured blood glucose for two hours against the same amount of carbohydrate taken as pure glucose.
The ranking surprised people. Vegetables gave the largest rises (about 70% of glucose), breakfast cereals about 65%, fruit 50%, dairy 35% and dried legumes the lowest, about 31%. Fat and protein in a food tracked a smaller glucose rise. Forty years later, the Indian studies below land on the same lesson: the dal on the plate matters.
Jenkins DJ et al.: Glycemic index of foods, Am J Clin Nutr 34(3):362–6 (1981)How the test is run
- Recruit. A group of healthy volunteers; FAO/WHO guidance is 8 to 12 or more.
- Feed. A portion with 50 g of available carbohydrate, and the glucose reference on a separate morning.
- Sample. Finger-prick blood over two hours.
- Divide. The area under the food's curve by the area under glucose's, times 100.
Bands: 55 or less is low, 56 to 69 medium, 70 or more high.
Two caveats
- Individual responses vary a lot, even within one lab.
- The 2021 international GI tables, which list over 4,000 foods, found that cereal foods, including whole-grain ones, vary widely between manufacturers and recipes.
What is the GI of common Indian staples?
From four feeding studies: ragi mudde 98, sorghum roti 84, rice idli 85, plain and onion dosa about 79, maize roti 75, milled rice 72 (average), pearl millet roti 70, upma 71, chapati 62, sorghum idli 61, broken wheat upma 52, vada sambar 37 and chickpea sundal 24.
See the data as a table
| GI (GI (glucose = 100)) | |
|---|---|
| Finger millet ball (ragi mudde) | 98.2 |
| Rice idli (dry mix) | 85 |
| Sorghum roti | 84.1 |
| Onion dosa | 79.69 |
| Plain dosa | 79.39 |
| Maize roti | 74.8 |
| Milled rice (mean of studies) | 71.7 |
| Upma (dry mix) | 71 |
| Pearl millet roti | 70.1 |
| Chapati | 62.43 |
| Sorghum idli | 61.3 |
| Millets (mean of studies) | 52.7 |
| Broken wheat upma | 51.7 |
| Vada sambar | 36.89 |
| Chickpea sundal | 24.1 |
Source: Shobana et al. 2022 (IJMR); Shakappa et al. 2022 (J Food Sci Technol); Tan et al. 2018 (Br J Nutr); Anitha et al. 2021 (Front Nutr) · Different labs, subjects and recipes; compare within a study where you can. Rice idli and upma were commercial dry mixes.
| Food | GI | GL (50 g carb portion unless noted) | Band | Study |
|---|---|---|---|---|
| Finger millet stiff porridge (ragi mudde) | 98.2 | 49.1 | High | Shobana 2022 |
| Rice idli (commercial dry mix) | 85 | n/a | High | Tan 2018 |
| Sorghum roti | 84.1 | 42.1 | High | Shobana 2022 |
| Plain dosa | 79.39 | 39.69 (highest in study) | High | Shakappa 2022 |
| Maize roti | 74.8 | 37.4 | High | Shobana 2022 |
| Pearl millet roti | 70.1 | 35.1 | High | Shobana 2022 |
| Chapati | 62.43 | 28.37 | Medium | Shakappa 2022 |
| Sorghum idli | 61.3 | 30.7 | Medium | Shobana 2022 |
| Methi paratha | 60.2 | 30.1 | Medium | Shobana 2022 |
| Broken wheat upma | 51.7 | 25.9 | Low | Shobana 2022 |
| Vada sambar | 36.89 | 18.44 (lowest in study) | Low | Shakappa 2022 |
| White chickpea sundal | 24.1 | 12.1 | Low | Shobana 2022 |

Researchers at the Madras Diabetes Research Foundation profiled 12 traditional millet, wheat, maize and pulse preparations and measured GI in 15 healthy, overweight or obese adults (12 to 15 per food after outliers), with 50 g available carbohydrate and a 50 g glucose reference over 120 minutes. Five foods were high GI, led by finger millet stiff porridge (98.2) and sorghum roti (84.1); four medium; three low, led by chickpea sundal (24.1). Resistant starch ranged from 0.49 to 3.95 g%. Their conclusion: a whole-grain base alone does not guarantee a low GI. The limit: one recipe per food and young adults without diabetes.
Read the paper (free)Why did ragi mudde test higher than rice?
Because GI measures the food, not the grain. Ragi mudde is fine flour cooked in water into a fully gelatinised paste, which digestive enzymes attack almost as fast as glucose is absorbed. Fine particle size and full gelatinisation can cancel the advantages of a whole grain.
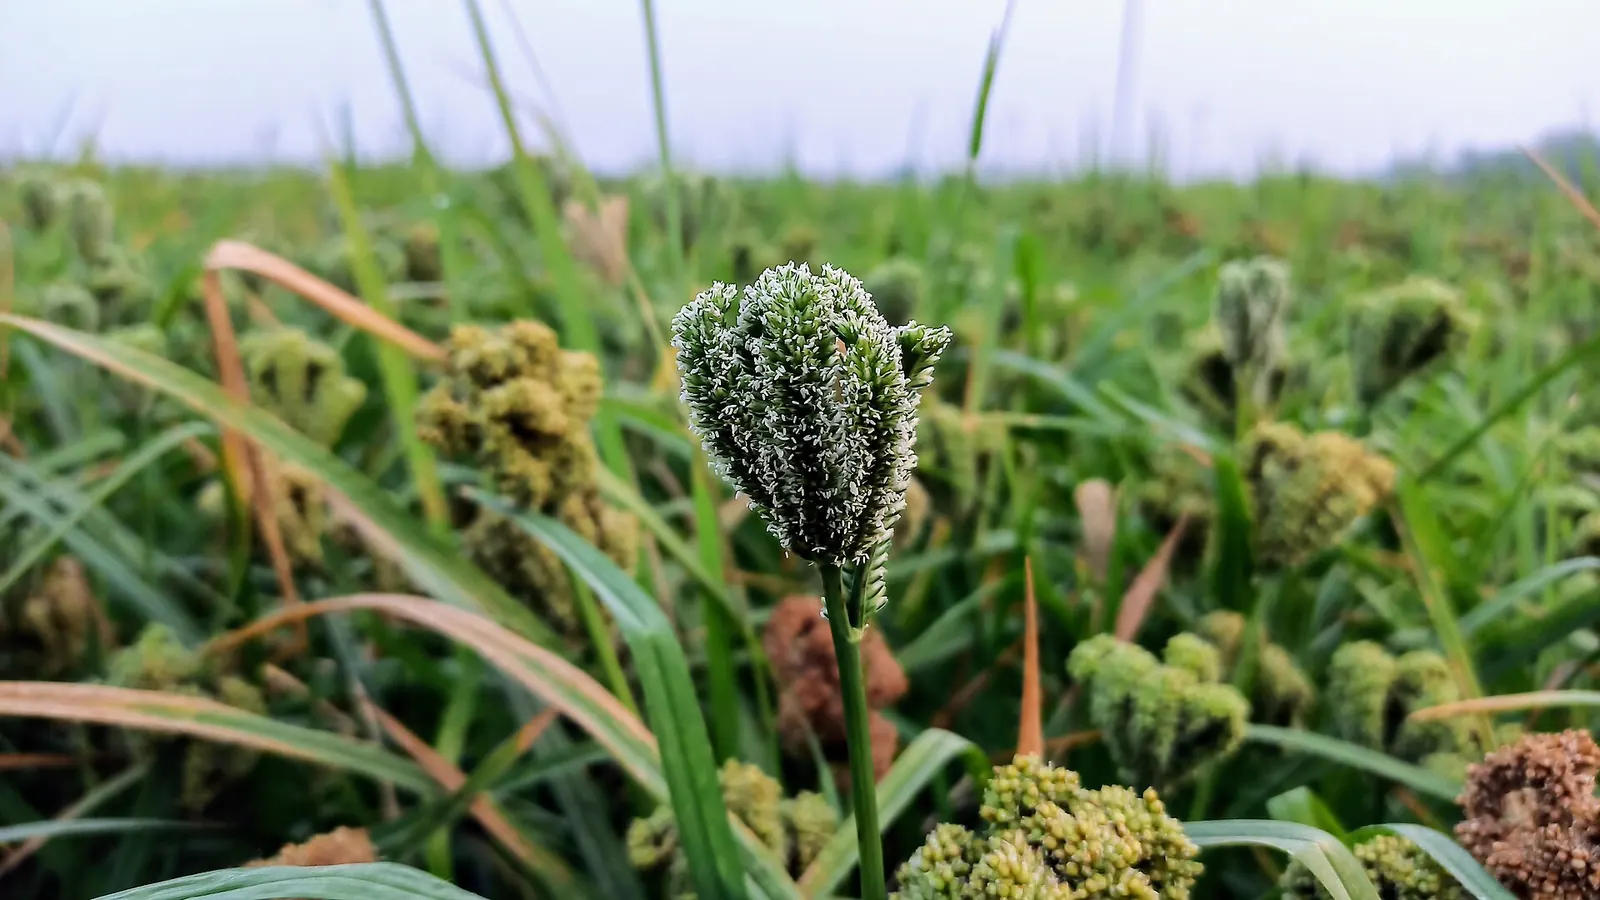
The millet meta-analysis
The 2021 millet meta-analysis shows the same pattern from the other side. Across studies, cooking raised millet GI against raw grain:
- steaming by 18.4 units;
- baking or roasting by 16.4;
- boiling by 11.3.
Finger millet averaged 61.1 across studies, medium rather than low. Millets still averaged 52.7 against 71.7 for milled rice and 74.2 for refined wheat, and long-term millet diets lowered fasting glucose by about 12% and after-meal glucose by about 15% in people with diabetes.
So millets help on average, especially as coarse, intact grains. Ragi flour cooked to a smooth paste is the exception that proves the rule. How the millets compare on fibre, iron and calcium is in Indian millets ranked.
The authors pooled 65 studies with usable data; 39 studies (111 observations) informed the GI analysis. Millets averaged a GI of 52.7 ± 10.3, against 71.7 ± 14.4 for milled rice and 74.2 ± 14.9 for refined wheat. By type: barnyard 42.3, foxtail 54.5, pearl 56.6, finger 61.1, sorghum 61.2, kodo 65.4. Steaming, baking and boiling raised GI by 11 to 18 units against raw grain. Long-term intake cut fasting and after-meal glucose by about 12% and 15% in diabetics, and HbA1c fell from 6.65% to 5.67% in prediabetic subjects. The limits: many small studies below the 10-subject norm, few used the ISO GI method, and the funnel plot showed publication bias.
Read the paper (free)Does fermentation lower the GI of idli and dosa?
Not enough to make them low-GI. Rice-based idli and dosa tested 76 to 85 in a 2018 trial with Indian and Chinese volunteers, and plain dosa 79 in a 2022 Indian study. The rice in the batter is gelatinised by steaming or griddle heat, and the urad dal share is too small to pull the number down.
What the breakfast trials found
The 2018 study fed 19 healthy young men (10 Indian, 9 Chinese) commercial dry-mix rice idli, rice dosa and upma alongside Western breakfast foods. Idli scored 85, dosa 76 and upma 71, while whole-grain Western cereals scored 44 to 55.
Across all ten foods, GI fell as protein (correlation −0.37), fat (−0.27) and dietary fibre (−0.42) rose. That is the lever that works for South Indian breakfasts: eat idli with sambar and chutney, not alone.
Protein, fat and fibre on the plate moved the number more than fermentation did.Tan et al., British Journal of Nutrition, 2018
In the 2022 Indian study, vada sambar, built on urad dal and fried in oil with a lentil gravy, came in at 37, the lowest of 23 breakfast foods. The fermentation story itself is in idli and dosa fermentation science.

Does cooling rice lower its glycaemic response?
Yes, modestly. Cooling cooked rice lets some starch retrograde into resistant starch, which escapes digestion in the small intestine. In a 2015 trial, rice cooled for 24 hours at 4°C and reheated had 2.6 times the resistant starch of fresh rice and a 18% lower glucose response.
Resistant starch was 0.64 g/100 g in freshly cooked white rice, 1.30 g/100 g after 10 hours at room temperature and 1.65 g/100 g after 24 hours at 4°C followed by reheating. In a randomised single-blind crossover with 15 healthy adults, the chilled-and-reheated rice produced a glycaemic response of 125 ± 50.1 against 152 ± 48.3 mmol·min/L for fresh rice (p = 0.047), about 18% lower. The limits: small sample, healthy subjects, one Indonesian rice variety, and a full GI was not calculated.
Read the paper (free)The effect depends on amylose: higher-amylose rice retrogrades more, so high-amylose rices should respond more than sticky, low-amylose ones. The grain science is in rice science: amylose, basmati and sona masoori. Leftover rice must be cooled quickly and refrigerated to be safe.
How much carbohydrate do Indians eat, and what do guidelines say?
A lot. The ICMR-INDIAB diet survey of 1,21,077 adults, published in Nature Medicine in 2025, found carbohydrates supplied 62% of daily calories on average, protein only 12%. ICMR-NIN's 2024 guidelines say cereals and millets together should supply no more than 45% of calories, and pulses, beans and meat up to 15%.
What the survey linked to diabetes:
- higher carbohydrate intake: about 14% higher odds of newly diagnosed type 2 diabetes;
- swapping 5% of calories from carbohydrate to plant or dairy protein: lower risk of diabetes and prediabetes;
- refined cereals carried higher odds than milled whole grains, but milled whole grains still raised them.
Switching rice for atta is not, on its own, the answer. The guidelines also cap added sugar at under 5% of energy. If you want to check carbohydrate and fibre per 100 g for your own staples, the method is in how to use ICMR-NIN's IFCT.
See the data as a table
| Share (% of energy) | |
|---|---|
| Carbohydrate (actual, all sources) | 62 |
| Cereals and millets (guideline cap) | 45 |
| Protein (actual) | 12 |
| Pulses, beans and meat (guideline) | 15 |
Source: ICMR-INDIAB diet survey (Nature Medicine 2025) via Down To Earth; ICMR-NIN Dietary Guidelines 2024 via The South First · Actual intake and guideline categories are not identical: total carbohydrate includes sugar and pulses, the cap covers cereals and millets only.
How do you use GI on an Indian plate?
Use it to compare preparations, not to ban grains. The biggest levers in the studies above are pulses and protein on the plate, coarser rather than finer grain, and smaller portions of the high-GI base.
- Lower the load before the index. GL scales with portion. Halving the rice and doubling the dal cuts the meal's load more than any switch of grain.
- Add legumes. Sundal, sambar, rajma and chana dishes test low (24 to 37 in the studies here) and pull down a mixed meal.
- Prefer coarse and intact. Broken wheat upma (52) beat chapati (62), and boiled millet grains beat millet flour pastes.
- Use cooled and reheated rice where food safety allows; expect a modest, not dramatic, effect.
- Be wary of "millet" labels. A millet product made from fine flour and cooked to a paste or crisped can be high-GI.
Use this to check what you just read: plug in a GI from the table and your real portion.
Glycaemic load of your portion
What's new
- ICMR-INDIAB: 62% of Indian calories come from carbohydrates, linked to higher diabetes odds Down To Earth, Oct 2025
- ICMR-NIN's 17 dietary guidelines cap cereals at 45% of calories The South First, May 2024 (latest official guidance)
- Chennai feeding study finds ragi mudde and sorghum roti high-GI, legume sundals low Indian Journal of Medical Research, 2022 (latest Indian GI data I found)
Questions people ask
Is ragi good for diabetics?
Ragi as a whole is medium-GI on average (about 61 across studies), but ragi mudde tested 98 in one Indian trial. Coarser preparations, smaller portions and pairing with dal or vegetables matter more than the grain.
Is chapati better than rice for blood sugar?
Usually somewhat. Chapati tested about 62 in one Indian study; milled rice averages about 72 across studies. But portion size and what you eat with either matter as much as the switch.
Does brown rice have a lower GI than white rice?
Often, but results vary widely between varieties and studies, and none of the Indian studies above tested it. The 2021 international GI tables found cereals, including whole-grain ones, among the most variable foods.
Is idli a low-GI breakfast?
No. Rice idli tested 85 and dosa 76 to 79 in feeding studies. Eating them with sambar and chutney lowers the meal's response; vada sambar tested 37.
Does reheating rice lower its GI?
Chilling cooked rice for 24 hours then reheating raised resistant starch from 0.64 to 1.65 g/100 g and cut the glucose response about 18% in a 15-person trial.
More from the Taste Lab on Rasa.
Sources
- Shobana et al.: Carbohydrate profiling & glycaemic indices of selected traditional Indian foods, Indian J Med Res 155(1):56–65 (2022)
- Shakappa, Naik, Sobhana: Glycemic carbohydrates, glycemic index, and glycemic load of commonly consumed South Indian breakfast foods, J Food Sci Technol 59:3619 (2022)
- Tan et al.: The glycaemic index and insulinaemic index of commercially available breakfast and snack foods in an Asian population, Br J Nutr 119:1151 (2018)
- Anitha et al.: A systematic review and meta-analysis of the potential of millets for managing and reducing the risk of developing diabetes mellitus, Front Nutr (2021)
- Sonia, Witjaksono, Ridwan: Effect of cooling of cooked white rice on resistant starch content and glycemic response, Asia Pac J Clin Nutr 24(4):620 (2015)
- Jenkins DJ et al.: Glycemic index of foods: a physiological basis for carbohydrate exchange, Am J Clin Nutr 34(3):362–6 (1981; source for the story)
- Atkinson et al.: International tables of glycemic index and glycemic load values 2021, Am J Clin Nutr 114:1625 (2021; source for cereal variability)
- Down To Earth: Indian diets heavy on carbs and sugar linked to surge in diabetes (ICMR-INDIAB, Nature Medicine) (2025)
- The South First: ICMR releases Dietary Guidelines for Indians after 13 years (2024)

Sapta (Saptarshi Sarkar) is a mechanical engineer turned marketer in Bengaluru and a solo touring rider. He writes the seven Saptaverse blogs. Work with him or read more of Foodblog.


